Dashboards provide a consolidated view of your data and insights.
To create a Dashboard:

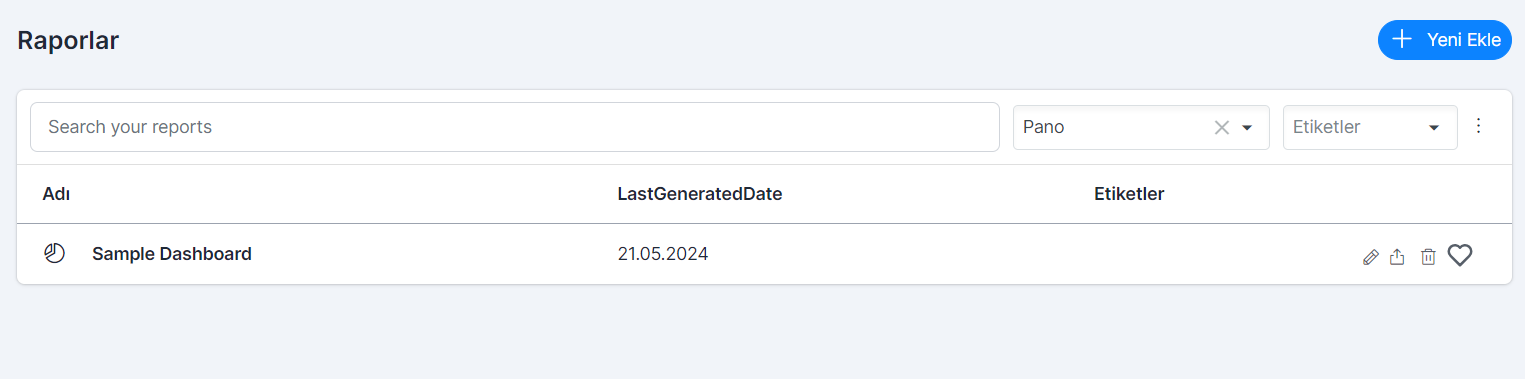
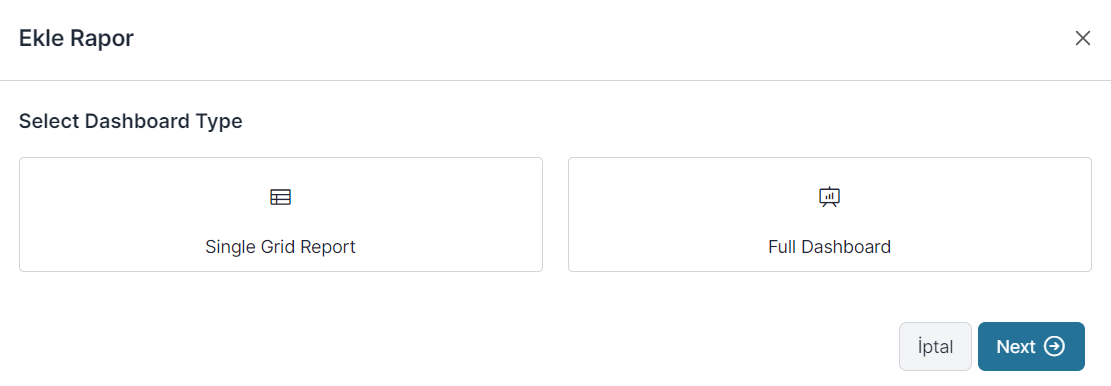
- Access dashboards: Go to Dashboard and click ‘Add New’.

- Select Dashboard Type: Choose from Single Grid Report or Full Dashboard.
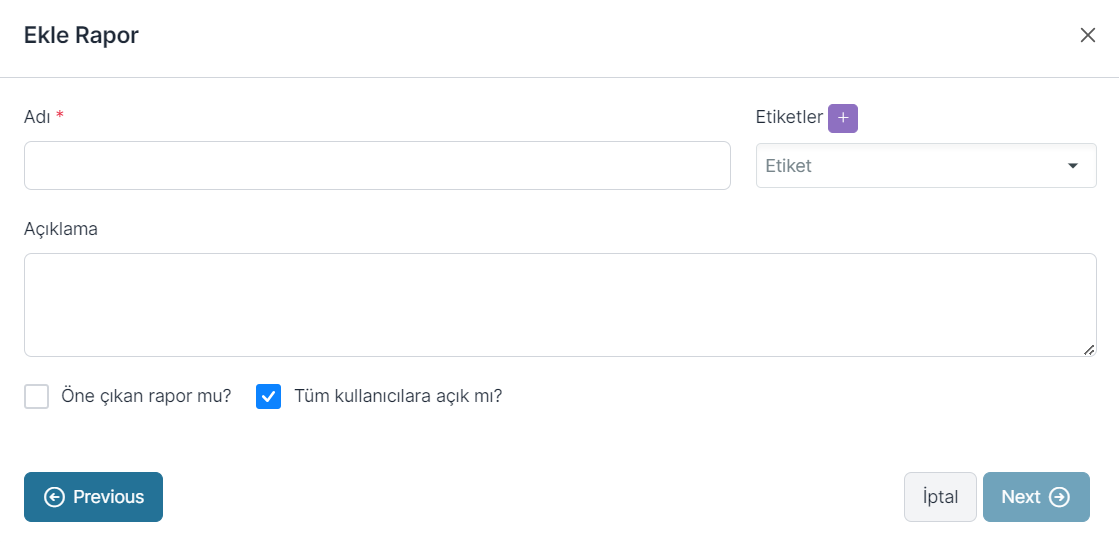
- Single Grid Report: Enter Report Name*, Label, Description, “Featured report?” and/or “Is it available to all users?” select and proceed
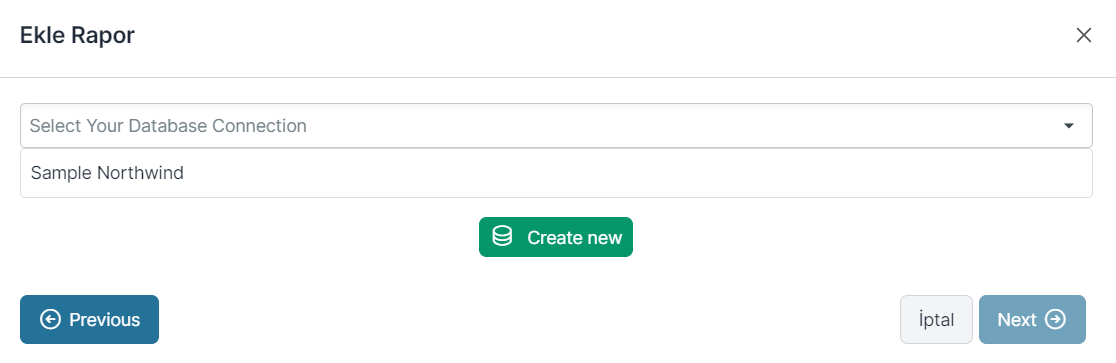
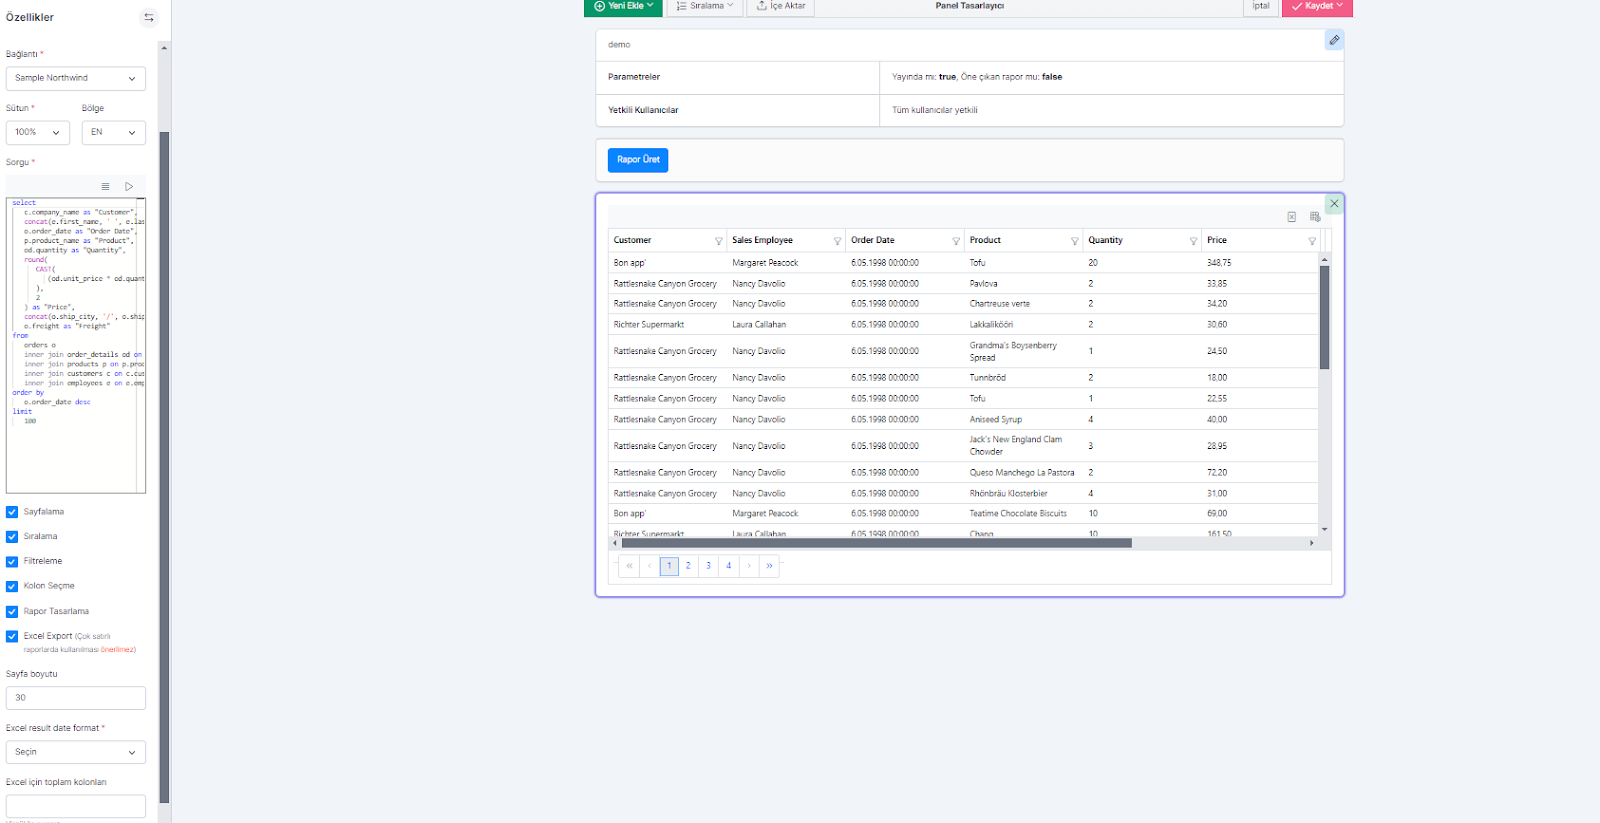
- Single Grid Report: Select the Data Source connection or click Create a new Connection(For this see)
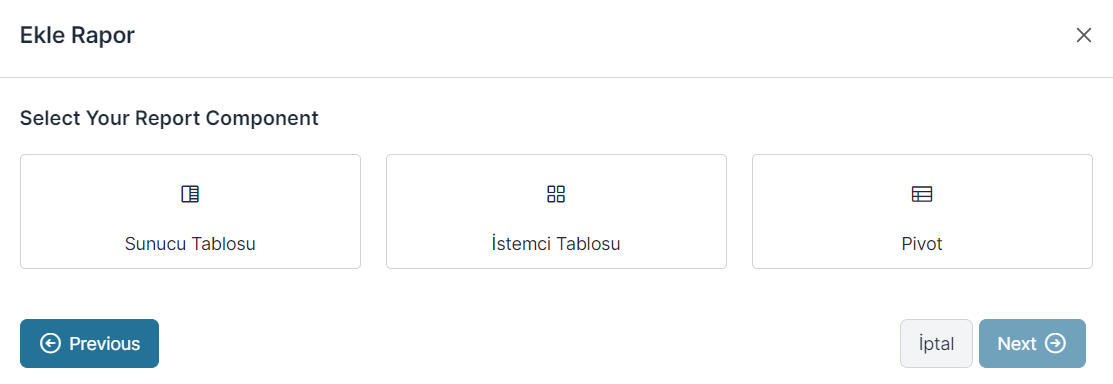
- Single Grid Report: Select the component you want from Server Table, Client Table or Pivot options.

- Single Grid Report: Choose the options you want from Paging, Sorting, Filtering, Column Selecting, Report Designing and Excel Export.
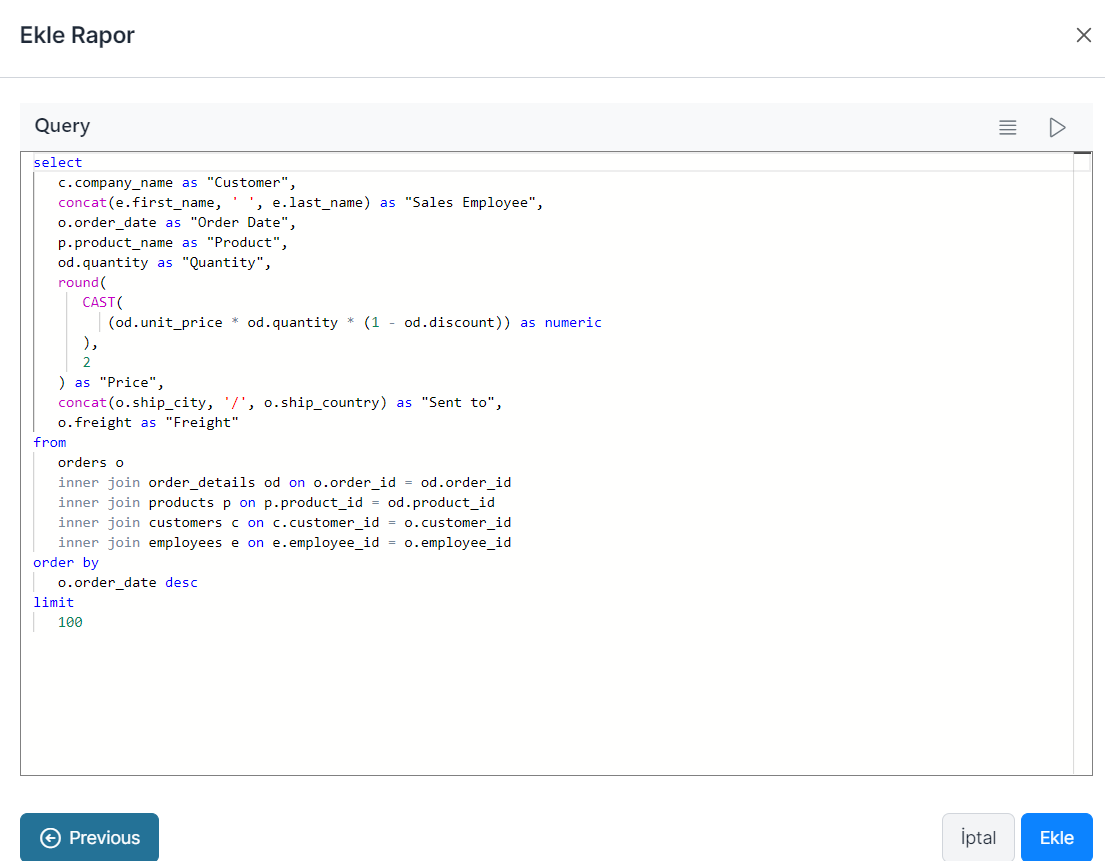
- Single Grid Report: Enter the required SQL query for your report and click Add.
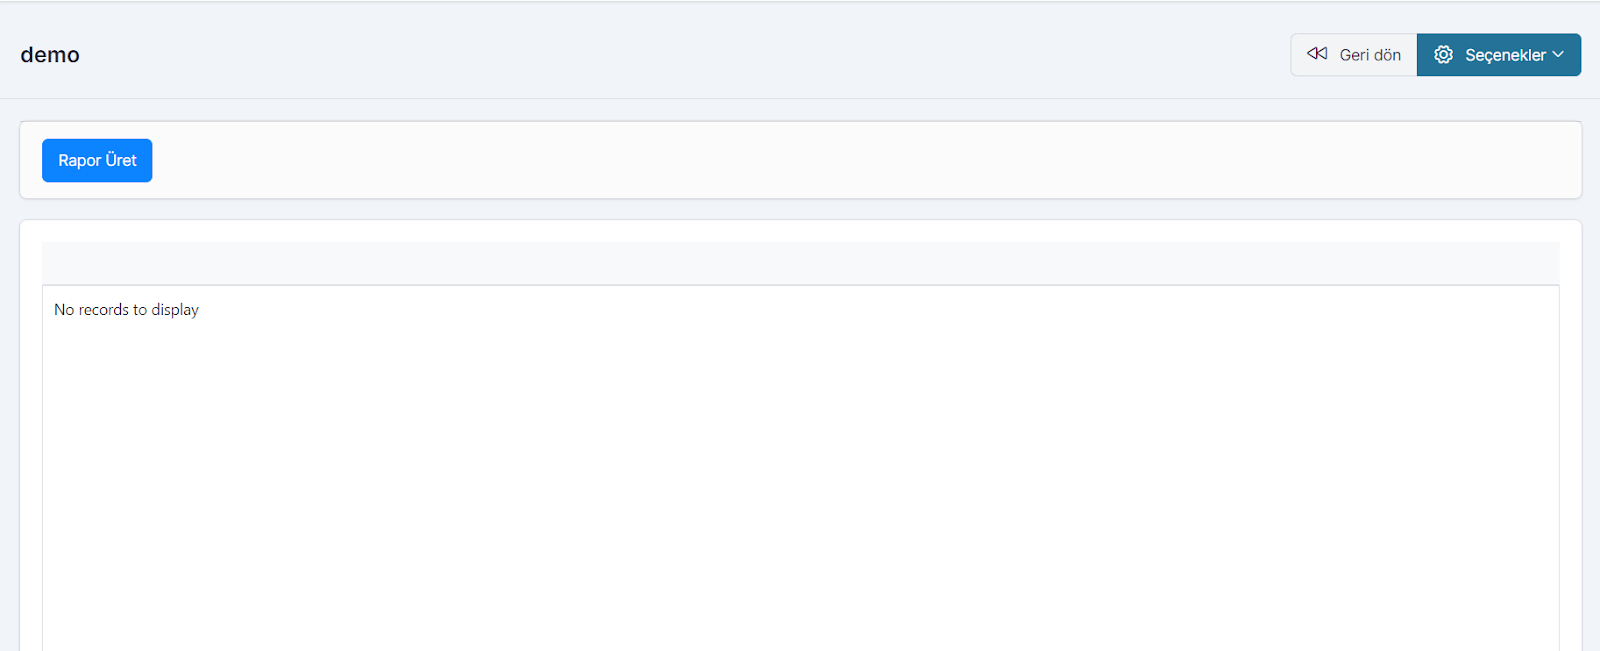
- Single Grid Report: Click the Generate Report button.
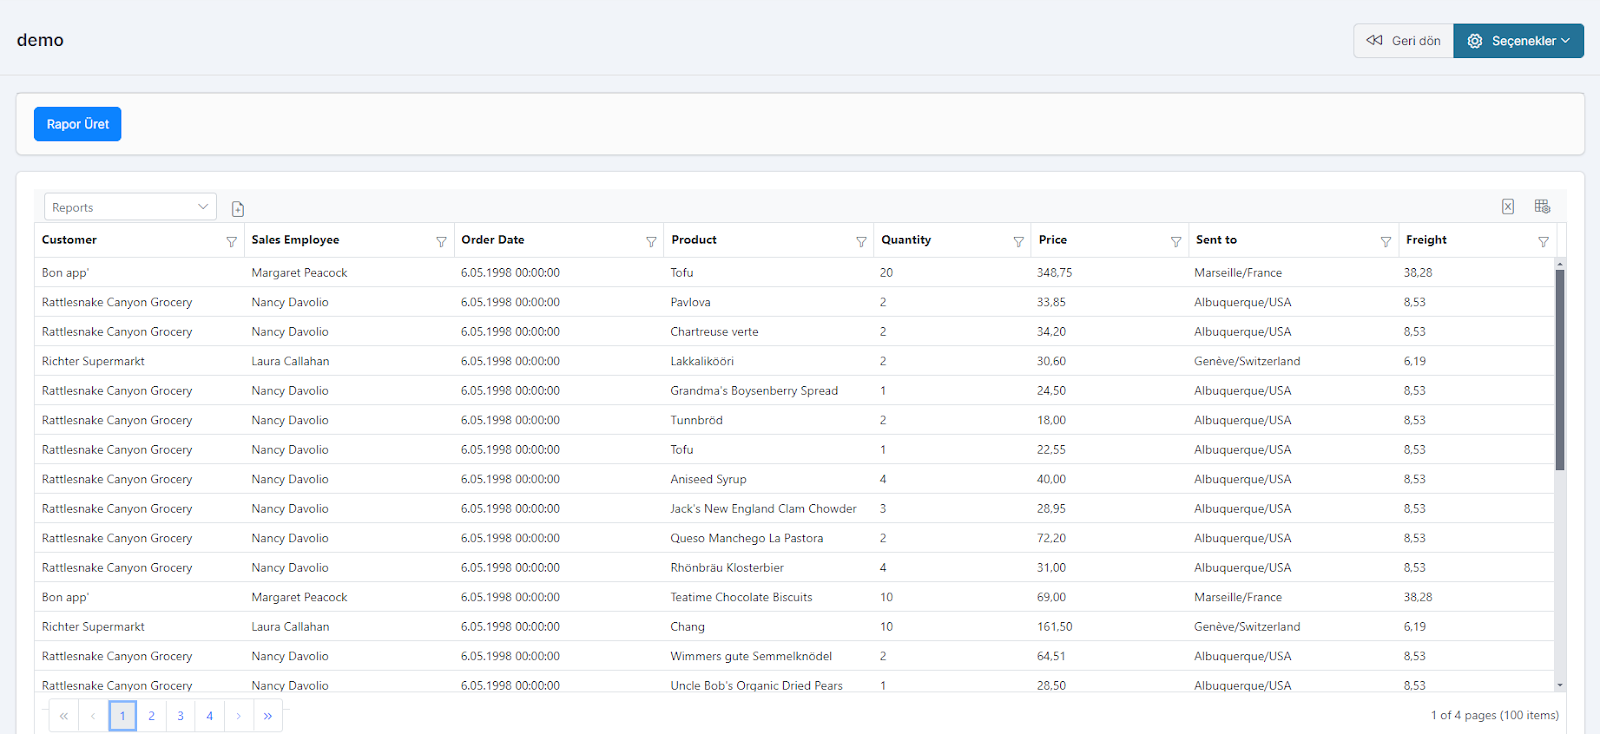

- Single Grid Report: View your resulting report and click Options to edit it.

- Layout and Design: Arrange the widgets in your dashboard and adjust their size and layout for optimal viewing.
- Save and Share: Once you’re happy with your board, save it. You can then share it with other users or teams as needed.
- Full Dashboard:Go to the Dashboard section and click ‘Add New’.
- Full Dashboard: Select the Full Dashboard option.
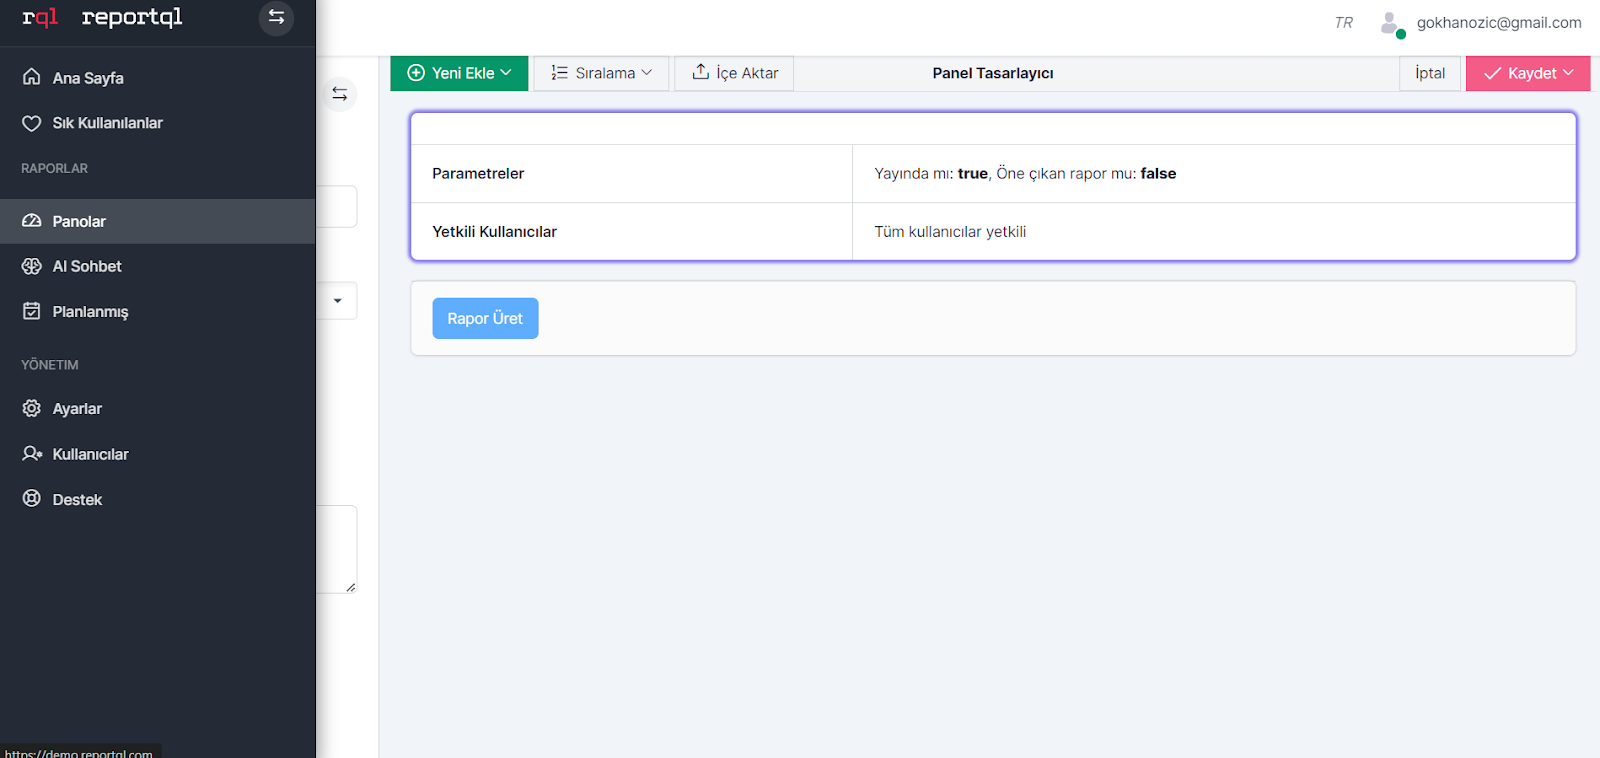
- Full Dashboard: On the screen that opens, press the “Add New” button to add a new component to your dashboard.
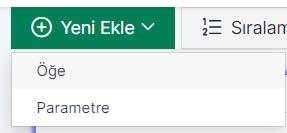
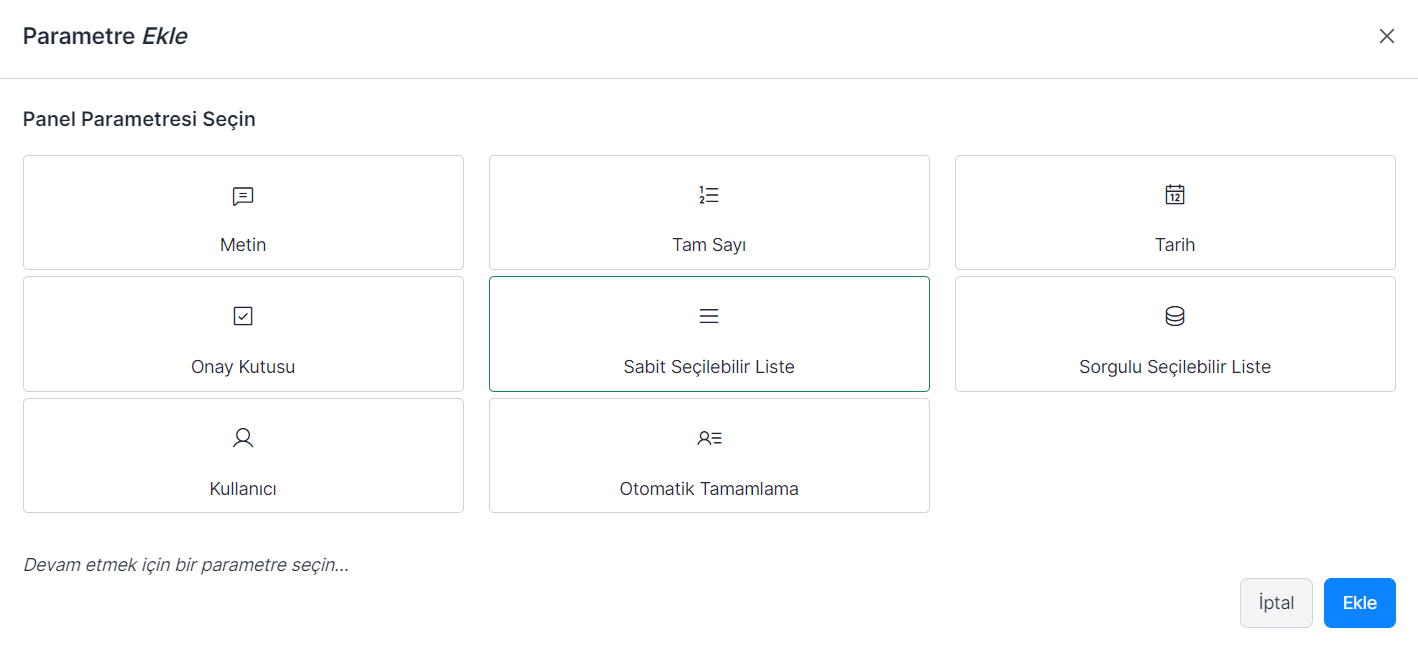
- Full Dashboard: Select Item or Parameter.

- Full Dashboard: Select the component you want to add.
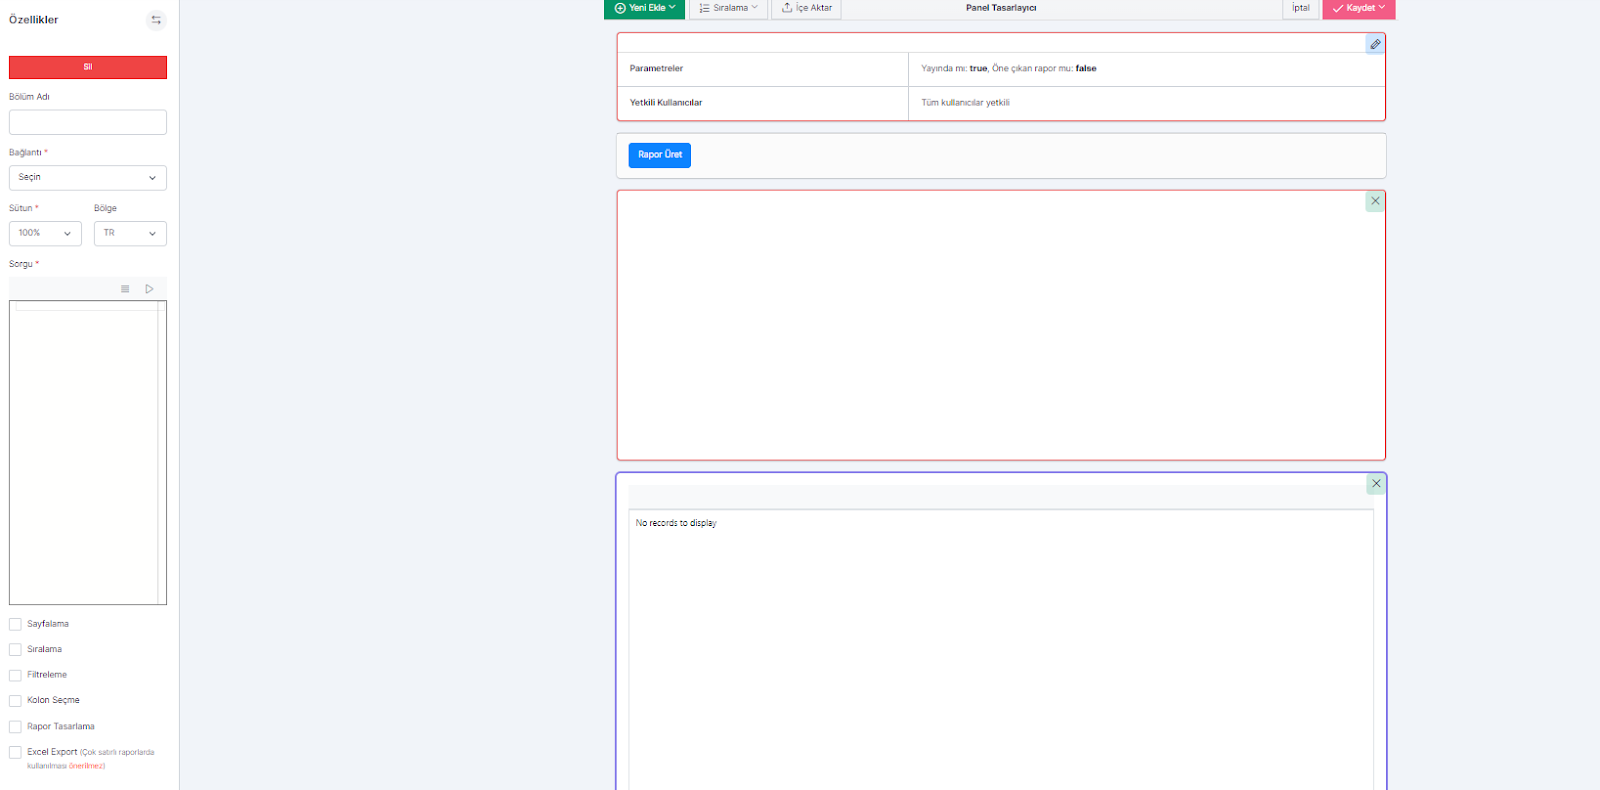
- Full Dashboard: Enter the Name, Size, Region, SQL query information of the component you added. (E.g. Server Table) Select the Paging, Sorting, Filtering, Column Select, Report Design and/or Excel Export options and save.
- Full Dashboard: Select one of the parameter options.
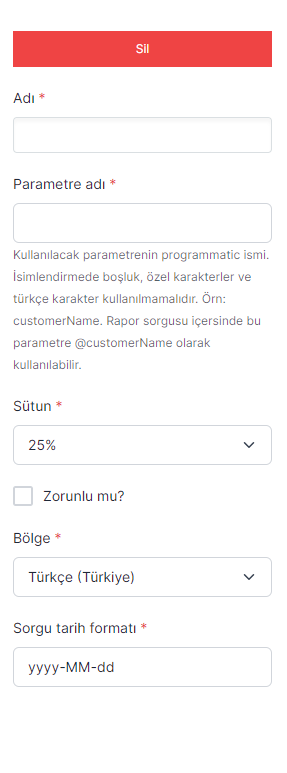
- Full Dashboard: Enter the Name, Parameter name, Size, Region and Query date format information and save the parameter.
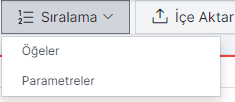
- Full Dashboard: To sort the items or parameters you added, click the Sort button and select the component you want to sort.
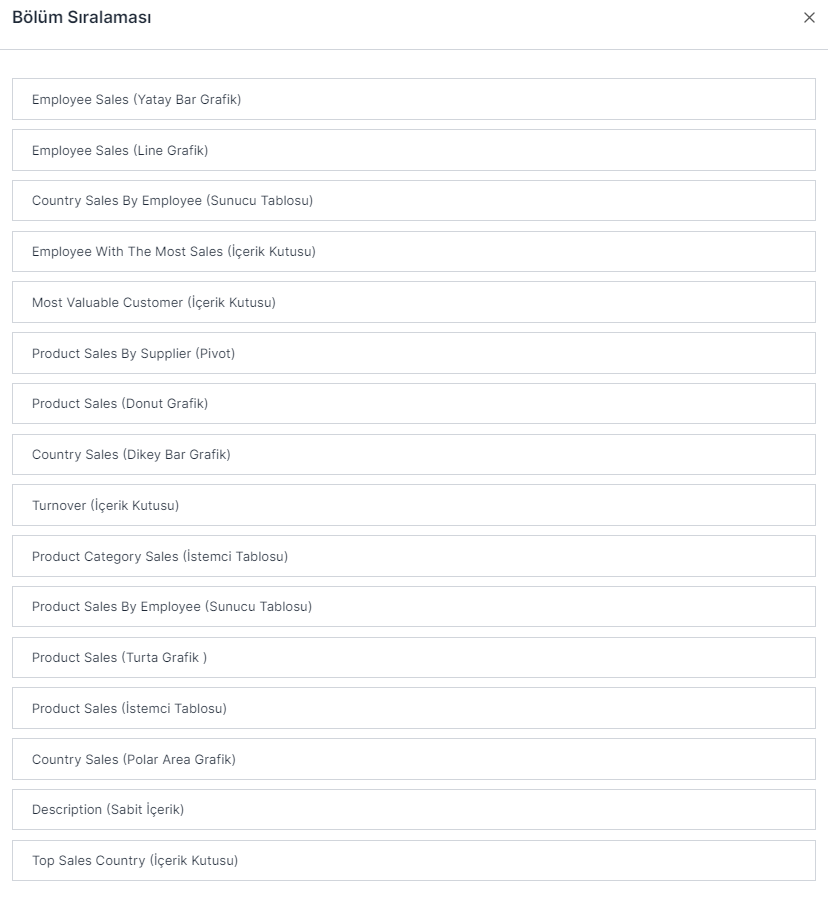
- Full Dashboard: Sort and save Dashboard items using drag-and-drop.
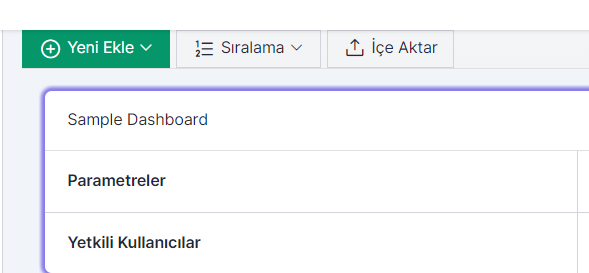
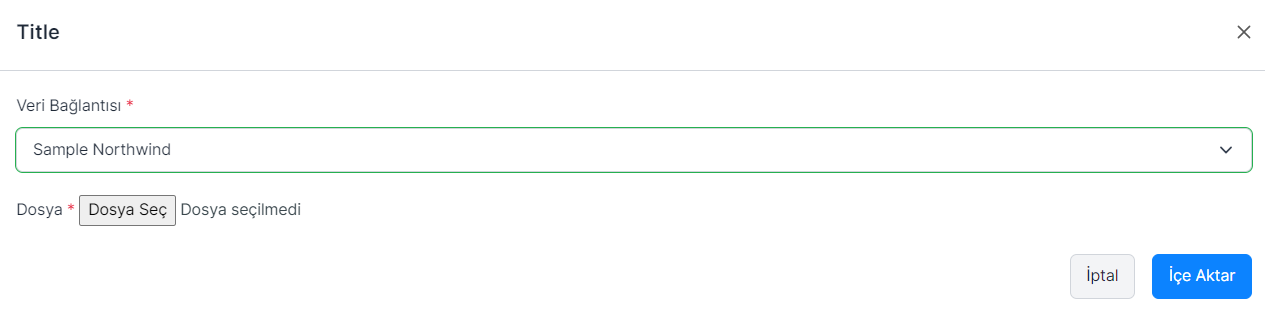
- Full Dashboard: By clicking the Import Option, you can view and edit the dashboards that were previously created and shared with you via Reportql.